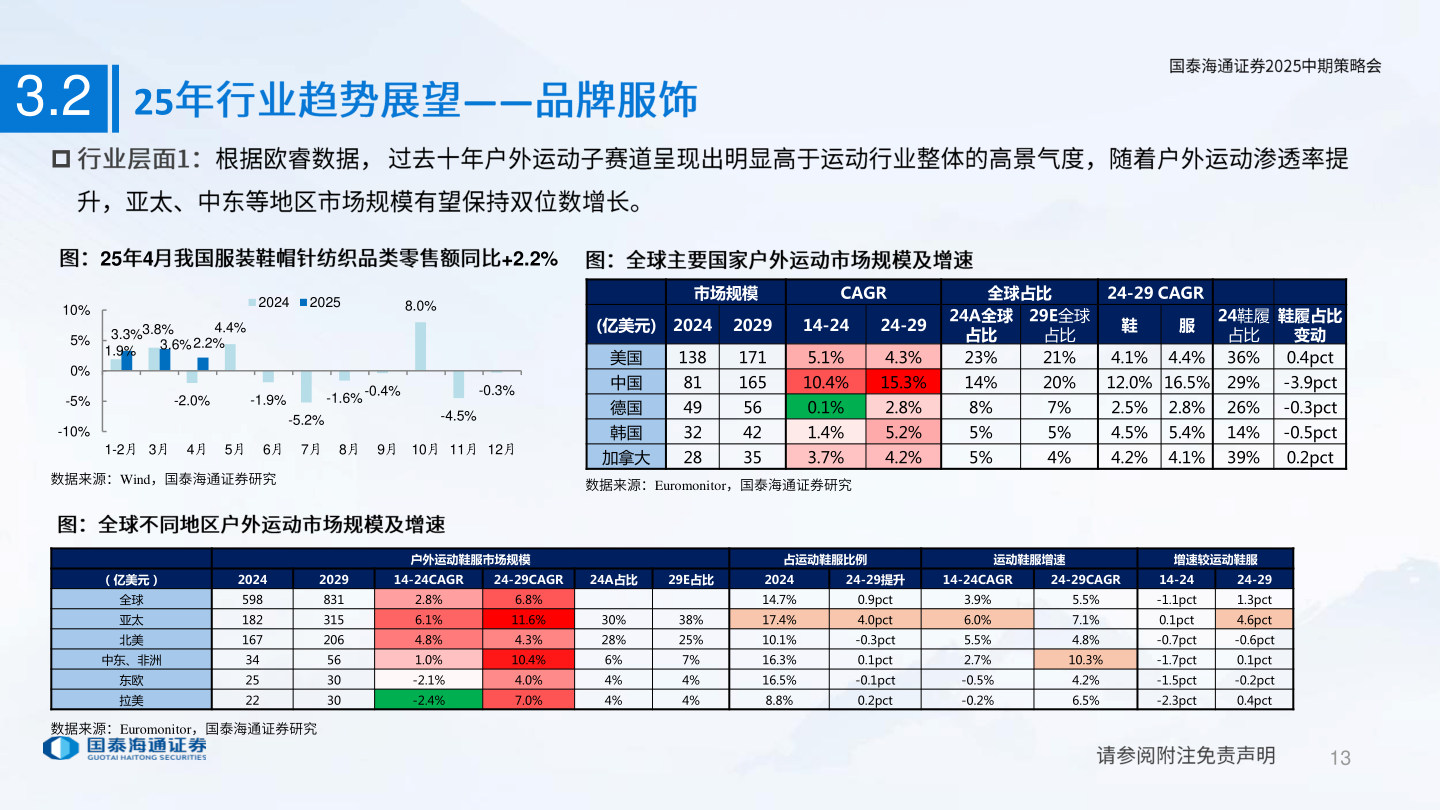
> 数据图表如何了解3.22025-5-33.225——25 4+2.2%10%5%0%-5%-10%202420258.0%4.4%3.8%3.3%1.9%3.6% 2.2%-2.0%-1.9%-0.4%-1.6%-5.2%-0.3%-4.5%1-2月 3月 4月 5月 6月 7月 8月 9月 10月 11月 12月数据来源:Wind,国泰海通证券研究市场规模CAGR全球占比24-29 CAGR(亿美元) 2024202914-2424-29美国中国德国韩国加拿大138814932281711655642355.1%10.4%0.1%1.4%3.7%4.3%15.3%2.8%5.2%4.2%数据来源:Euromonitor,国泰海通证券研究24A全球29E全球占比23%14%8%5%5%占比21%20%7%5%4%24鞋履鞋履占比鞋服占比变动4.1% 4.4% 36% 0.4pct12.0% 16.5% 29% -3.9pct2.5% 2.8% 26% -0.3pct4.5% 5.4% 14% -0.5pct4.2% 4.1% 39% 0.2pct户外运动鞋服市场规模占运动鞋服比例运动鞋服增速增速较运动鞋服(亿美元)2024202914-24CAGR24-29CAGR24A占比29E占比全球亚太北美中东、非洲东欧拉美5981821673425228313152065630302.8%6.1%4.8%1.0%-2.1%-2.4%6.8%11.6%4.3%10.4%4.0%7.0%30%28%6%4%4%38%25%7%4%4%202414.7%17.4%10.1%16.3%16.5%8.8%24-29提升14-24CAGR24-29CAGR0.9pct4.0pct-0.3pct0.1pct-0.1pct0.2pct3.9%6.0%5.5%2.7%-0.5%-0.2%5.5%7.1%4.8%10.3%4.2%6.5%14-24-1.1pct0.1pct-0.7pct-1.7pct-1.5pct-2.3pct24-291.3pct4.6pct-0.6pct0.1pct-0.2pct0.4pct数据来源:Euromonitor,国泰海通证券研究13国泰海通综合其他